
FLAME Visualiser Documentation
FLAME Visualiser Screenshot
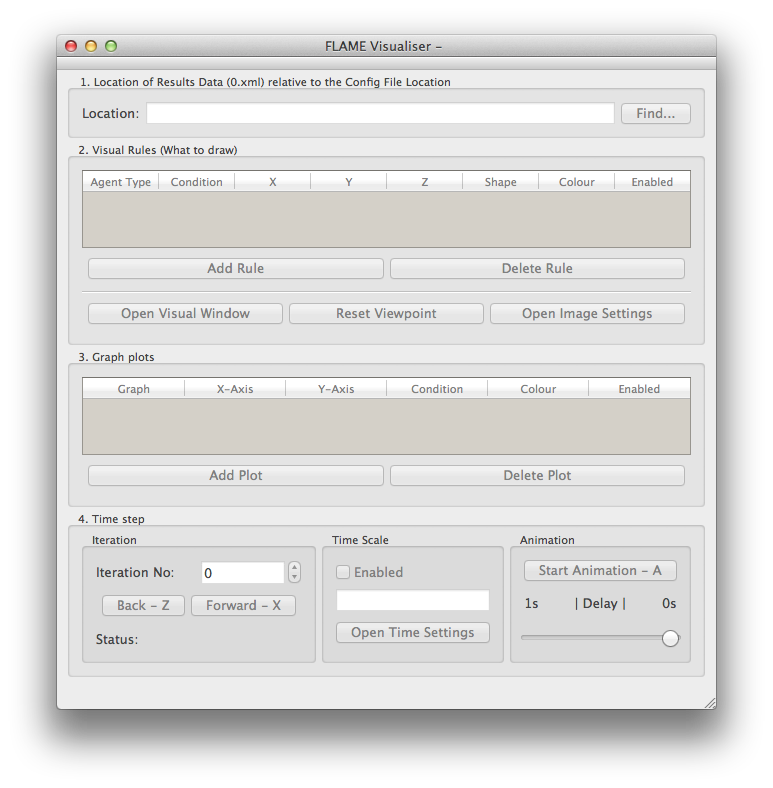
The FLAME Visualiser window contains:
- The Location of Results Data text box.
- The Visual Rules table.
- The Graph Plots table.
- The Time Step controls.
Config Files
New config
Click File on the menubar and select New. A dialog appears asking for a file name and location. New config files require a location because the location of results data is relative to the config location.
Open config
Click File on the menubar and select Open… and using the dialog that appears select the config file.
Save config
Click File on the menubar and select Save. To save as a different file then select Save As… and using the dialog that appears select a file.
Close config
Click File on menubar and select Close.
1. Location of Results Data
Select the location
Either directly edit the location text box or click the Find… button and use the dialog that appears to select the directory.
2. Visual Rules
Add a rule
Click the Add Rule button and a default row is added to the visual rules table.
Delete a rule
Click the Delete Rule button and any selected rule is deleted from the table.
Select agent type
Each rule relates to an agent type that is to be visualised. Double click the Agent Type cell and using the combo box select an agent type. The agent types are automatically read in from results files that have been successfully read.
Select a condition
Sometimes you only want to visualise certain agents from a given type. By double clicking on the Condition table cell using the dialog that appears you can enable a condition and set it. A condition is currently an agent memory variable related to a numerical value by a logic operator.
Set X, Y and Z
The position in Cartesian space on the x, y and z axes can be set by double clicking the X, Y or Z table cells. The position can depend on agent memory variables or a numerical value or both.
Select shape
Double click the Shape table cell and a shape dialog appears. Using the dialog the shape can be set and its size.
Enable/disable a rule
The last Enable column allows you to enable or disable rules easily.
Open/close visual window
Click on the Open Visual Window button to open the visual window. To close the visual window either click the Close Visual Window button or click the close button on the visual window or press the esc key.
Reset Viewpoint
Resetting the viewpoint orientates the scene in front of the camera as a top town view of the x-y plane to get all the agents in.
Open image settings
An image setting dialog appears which can be used to save images from the visual window. Either take single images using the Take snapshot button or select Take snaphots during animate mode to automatically take snapshots of each frame when animation is used.
The Visual Window
Spin the visual model
Hold the left mouse button over the visual window and move the mouse or use the arrow keys.
Zoom the visual model
Hold the right mouse button over the visual window and move the mouse up and down.
Change the Near Clip Plane
The near clip plane can be changed by holding down the C key and the right mouse button and moving the mouse up and down.
Pick an Agent
An agent can be picked and its memory displayed by holding down the P key and left mouse clicking on an agent. The agent picked is highlighted.
Move the Centre of the Visual Scene
The scene can be shifted up, down, left and right by holding down the spacebar and the left mouse button and moving the mouse.
Restricting Drawing Axes
By selecting ‘Restrict Axes’ from Visual on the menubar the drawing of agents can be restricted on the x, y and z axes. When the minimum value sliders are fully to the left and the maximum value sliders are fully to the right those restrictions are turned off.
Perspective and Orthogonal view
By selecting Perspective or Orthogonal from Visual then View… on the menubar the view can be changed.
Background Colour
By selecting Background… from Visual on the menubar the background colour can be changed.
Changing the iteration
The X and Z and A keyboard buttons can be used to control the current iteration.
3. Graph plots
Add a plot
Click the Add Plot button and a default row is added to the graph plots table.
Delete a plot
Click the Delete Plot button and any selected rule is deleted from the table.
Select a graph
Each plot can have its own graph or if plots have the same graph number they will be drawn on the same graph.
Select x-axis
The x-axis can currently be iteration or time scale.
Select y-axis
The y-axis can currently be an agent type.
Select a condition
Sometimes you only want to plot certain agents from a given type. By double clicking on the Condition table cell using the dialog that appears you can enable a condition and set it. A condition is currently an agent memory variable related to a numerical value by a logic operator.
Set colour
Set the colour for the plot to be drawn in.
Enable/disable a plot
The last Enable column allows you to enable or disable plot graphs easily. An enabled plot will automatically produce a graph window.
The Graph Windows
Plotting data
Plot data is only collected by incrementing through iterations.
Graph style
The plotting style can be changed by selecting options from Style.. from Graph on the menubar.
Changing the iteration
The X and Z and A keyboard buttons can be used to control the current iteration.
4. Time step
Iteration
Select the current iteration by using the number spin box or by using the back and forward buttons. The status shows if the iteration was read correctly.
Time scale
A time scale can be set for each iteration. This can be set using the time scale dialog that is opened by pressing the Open Time Settings button.
Animation
Iterations can be automatically incremented by starting the animation.